
Try it in the browser
Open Play. Paste a block. No account, no install.
OPEN SOURCEv2 · MIT
Write a table in a Markdown code block. MarkVis draws the chart. Change a number — the picture changes. If the chart cannot draw, you still see the table.
The pictures below come from the same Markdown as the numbers. Nothing is hand-traced.
Open Play. Paste a block. No account, no install.
Notes, READMEs, docs sites. The numbers stay in the file.
The same block always draws the same chart. Not a one-off screenshot.
If something is wrong, you still see the rows — never a blank hole.
bar, line, area, scatter, pie, hist. That is the set.
Comma-separated rows or a Markdown table. Not a blob of JSON.
A person or a model writes the same block. Not a screenshot.
folio is the default. Light and dark on this site are the page, not the chart.
Save a picture next to the text so any viewer can see the chart.
Copy a block. Paste it in Play. That Markdown code block is the chart.
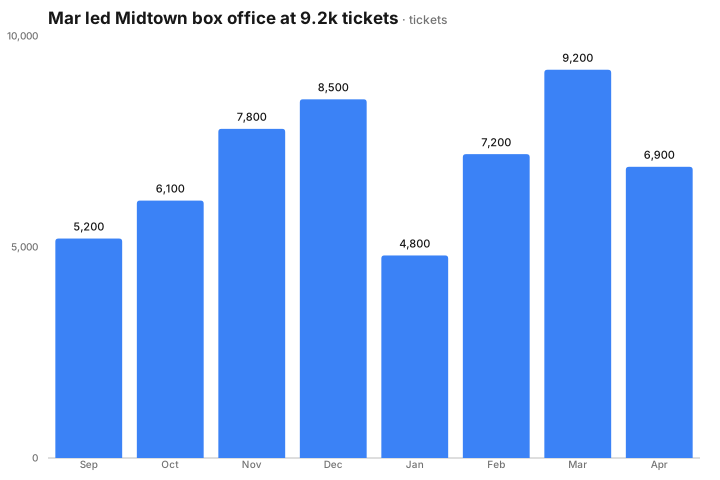
```chart
markvis: 2
type: bar
title: Mar led Midtown box office at 9.2k tickets
unit: tickets
x: month
y: tickets

month,tickets
Sep,5200
Oct,6100
Nov,7800
Dec,8500
Jan,4800
Feb,7200
Mar,9200
Apr,6900
```
CSV body. Title is a conclusion.
Open in PlaygroundOpen /play. Paste a block. The chart appears.
Same text, same picture.
Keeps the Markdown; writes the picture after it so GitHub can show it.
skills/markvis/SKILL.md
Point an agent at the Skill or /llms.txt. It writes the block, not a screenshot.


Write the numbers. Get the chart. The table stays in the file.